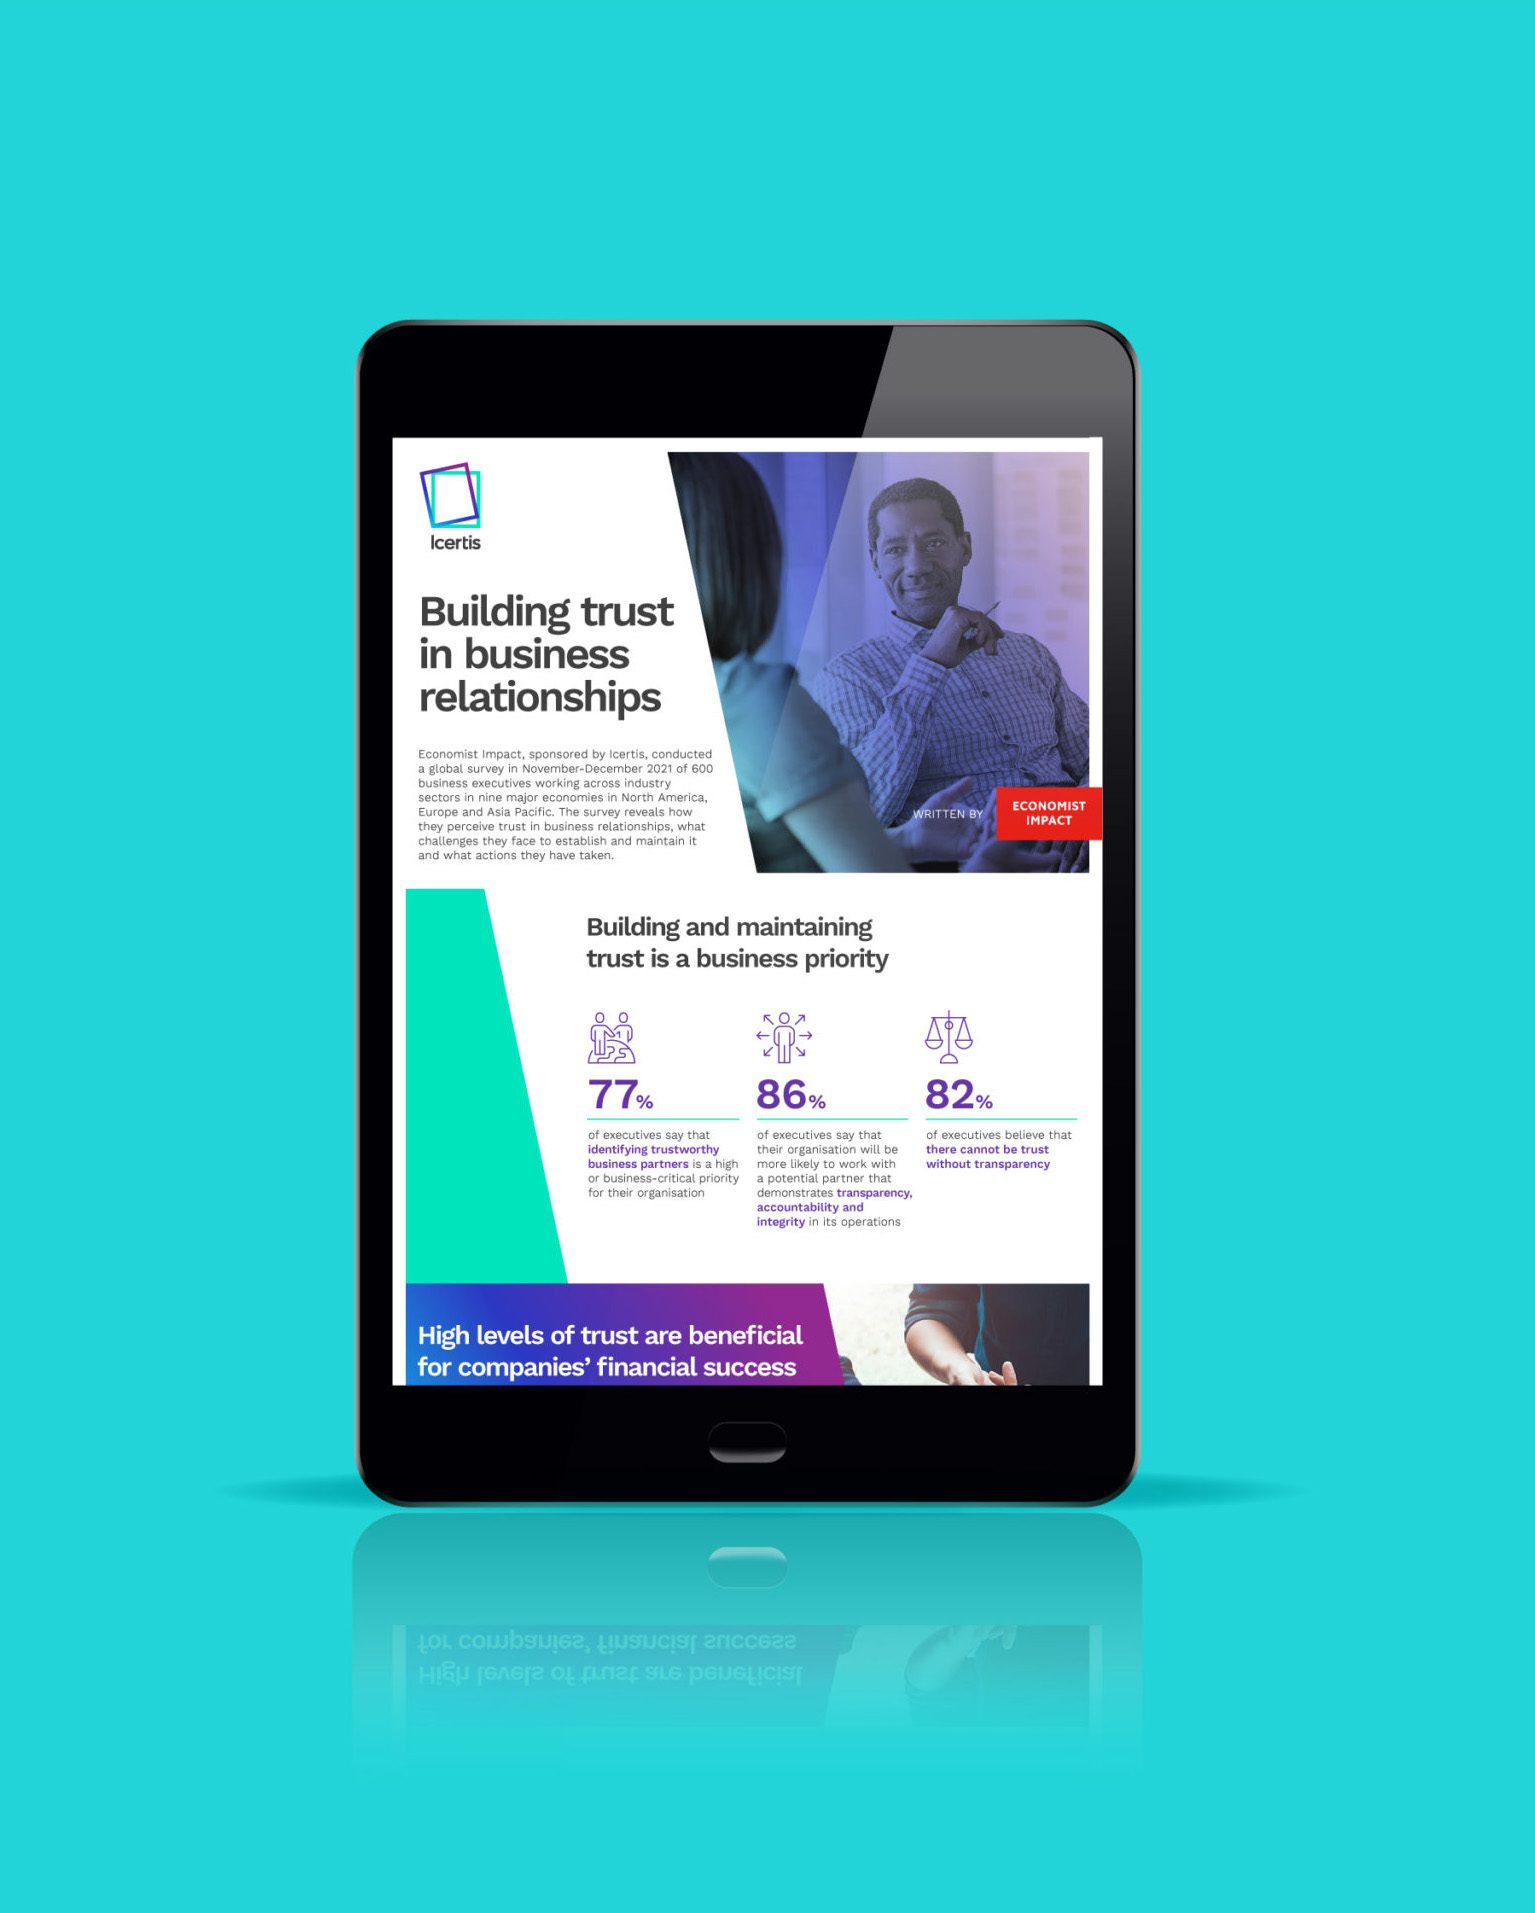
Infographic Design
The power of infographic design
At NWC Design, we create stunning, informative infographics that transform complex data into visually engaging content. Our expertise helps businesses convey messages clearly and effectively, making it easier for audiences to understand.
Infographics are a powerful tool for engaging viewers in a world of short attention spans and digital inundation. We’ll ensure your content packs a punch with eye-catching and digestible visuals.
Our expertise with infographics
With years of experience and a diverse portfolio, NWC Design has extensive experience in infographic design across various industries. Our team of infographic designers and data visualisation experts works closely with clients to understand their unique goals.
Together, we design infographics that are aesthetically pleasing and highly informative.
Our expertise covers a breadth of industries and topics:
- Digital transformation
- Renewable energy
- C-suite restructures
- Banking and finance
- Artificial Intelligence
- Connectivity
- Sustainability
- Healthcare and life sciences
Benefits of infographic design
Infographics are a vital component of effective content marketing strategies. They combine the power of visuals and data to communicate information quickly and clearly, making them an invaluable asset for any business.
- Enhance viewer engagement
- Boost search engine rankings & backlinks
- Improve information retention
- Reinforce brand identity
- Drive more online traffic
- Increase social media reach
- Simplify complex data
- Encourage virality & learning
Our infographic design process
Here’s how we’ll partner with you to create infographics that deliver:

1. Understand
We work with you to understand your objectives, brand and audience, and to explore the content for your infographic design.
2. Visualise
We start creating the visualisation techniques, narrative structure and graphics that best fit your content, audience, brand and objectives.
3. Show
We show you a sample of the infographic design and make sure you’re happy with the direction it’s taking.
4. Complete
We complete the full infographic design, make any edits you need, and ensure you have all the assets to repurpose and promote your infographic.
Get started with NWC Design
Ready to elevate your content and engage your audience?
Why choose NWC Design for infographic design?

NON WOOD
Founding Director, NWC Design
“We bring over eight years’ experience in infographic design, delivering over 1,000 infographics to audiences around the world.
Our visual storytelling expertise, data visualisation creativity and information design specialists work with you to ensure your infographics are tailored to your objectives and audience – and we equip you with all the assets you need to make them work as hard as they can for you.”
Client testimonials
Our clients love the transformative power of our infographics, and their feedback speaks volumes about our dedication to quality and creativity.
Ready to start your infographic design?
Frequently asked questions
What is infographic design?
Infographic design is the presentation of complex information or data in a highly visual and engaging way.
Our infographic design starts with an understanding of the needs of your audience, is based on detailed insight into the information you need to convey, and keeps your business outcomes clearly at the heart of our structure and design.
Using imagery, data visualisations and a clearly defined narrative flow, we deliver an accessible, easy-to understand, persuasive and memorable overview of what you have to say – using minimal text for maximum impact.
How does infographic design work?
Infographic designers tap into the shortcuts that visuals offer to aid the comprehension and retention of complex ideas and data.
- Engaging infographics quickly capture attention.
To gain several minutes of user attention, your value proposition must be clearly communicated within 10 seconds. - Visual infographics rapidly convey information.
An image can be understood as much as 600x faster than using words alone. - Images used in infographics promote better understanding.
Research shows that the introduction of images boosts understanding from 70% to 95%. - People share and interact with infographics.
Visual content promotes engagement, through social shares, clickthroughs, and dwell time. - Infographics convince and build trust.
People are more likely to trust and believe information when it’s easier to understand.
Visual infographics help you tell your story quickly and convincingly, no matter how complex your research, ideas or
proposition.
How can I use infographics for thought leadership and research?
There are so many ways you can demonstrate your thought leadership and quickly outline the benefits of your approach using infographic design.
- Provide a quick overview of a topic.
- Explain a complex process, structure or argument.
- Display your research findings or survey data.
- Summarise a long blog post or a detailed report.
- Compare and contrast multiple options.
- Raise awareness about an issue or cause.
How can I use infographics for marketing?
Infographic design can be used to support every aspect of your marketing.
- It can be used online as a standalone piece or as part of a blog post.
- It can be a part of your printed sales materials or used as a summary of research findings in a printed report.
- It can be used to promote interaction and shares in your social marketing channels.
What type of infographic do I need?
The beauty of infographic design is that it can be used effectively throughout your sales pipeline to achieve a number of different business outcomes.
Below are the main types of infographics we can create for you and some of the ways they can support you throughout your sales cycle.
1. Statistical infographics
Used for:
- Demonstrating thought leadership to your market through the distillation of data contained in a piece of complicated research.
- Highlight your market position or growth.
- Share data that supports your proposition.
2. Process infographics
Used for:
- Simplifying new customer onboarding.
- Describing complicated industrial or medical processes.
- Outlining recruitment stages or a restructure plan.
3. Timeline infographics
Used for:
- Illustrating company or market growth.
- Detailing upcoming product updates to existing or potential customers.
- Outlining the changing trends that will impact your audience.
4. Comparison infographics
Used for:
- Demonstrating the benefits of your product and pricing options.
- Clearly showing the benefit of your proposition over competitors.
- Comparing the characteristics of different market segments.
What does the quote include?
Our quotes cover creating a sample design, to check your happy with the direction, the full design, two rounds of edits (<25% of the content) and the final pdf / jpg. We’re also happy to provide you with the original artwork files if you need.
How do I get started with my infographic design?
Just get in touch either by email or phone and we’ll have a quick chat to understand what you’re looking for. We’ll discuss the aims for your infographic, the content and audience. We'll confirm a quote and get started on creating your engaging visual!