
Following a conversation with a client about why we felt we had to rewrite and restructure the content that they’d sent us for an infographic design, we thought we’d share our knowledge about what makes a good, and therefore effective, infographic structure.
We’ve also put together a handy FREE INFOGRAPHIC TEMPLATE to help you plan and make the best use of your content when creating infographic designs.
What makes a good infographic?
Creating an effective infographic that drives results and hits targets isn’t just about the quality of the data or a crazy-cool design – on their own they’re not enough. Good infographic design is a unique mix of creativity, structure and psychology; all the way from planning the content to communicating it.
“Good infographic design is a unique mix of creativity, structure and psychology; all the way from planning the content to communicating it.”
Over the past few years our team has directed, designed or produced over 1,000 infographics across a huge range of industries and topics. In that time, we’ve worked closely with outreach and PR teams to refine and improve the effectiveness of our infographic design in order to produce the results our clients required.
Here are our three key elements to creating the ideal infographic:
1. Make it useful
2. Make it accurate
3. Make it engaging
1. Make it useful
We mainly work with B2B information, most often derived from new research which generates fresh data and insights. This is then underpinned and corroborated by wider research using primary sources.
The purposes of these infographics are:
- to raise awareness of the new research
- to be shared among the target communities and generate engagement and discussion
- to position the client as an expert in their field
In order to fulfil these purposes, the infographic design needs to be useful. The more useful it is, the more value it will provide to readers and the more it will be shared. And the more it is shared, the more attention it will receive.
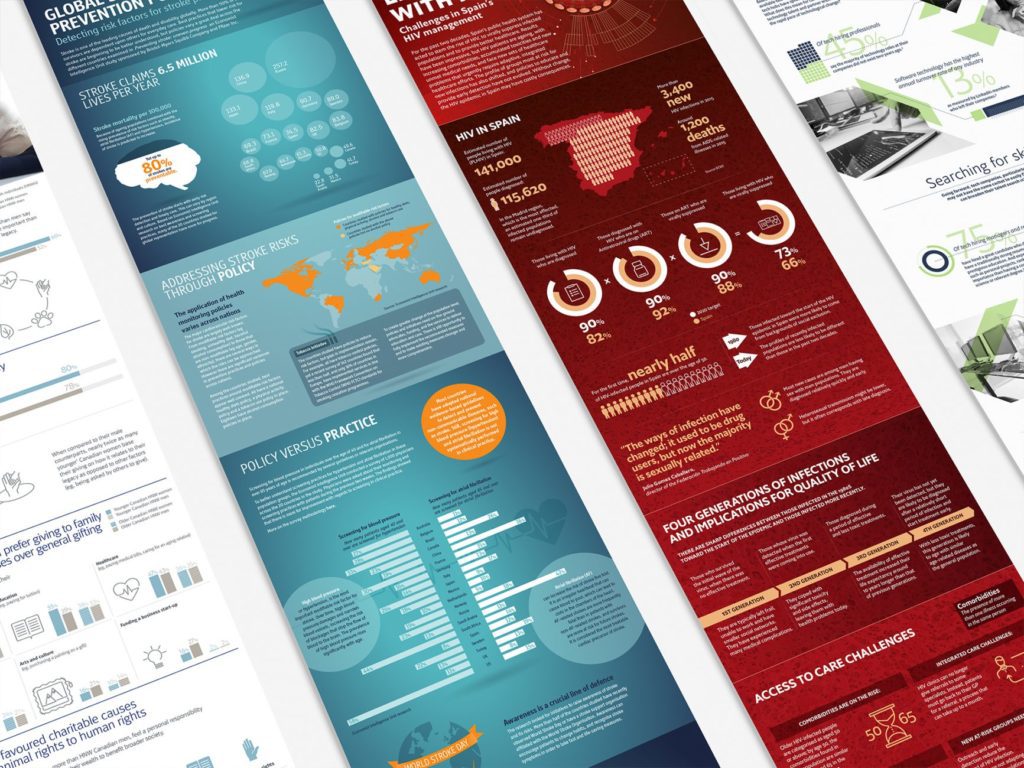
The most effective narrative for these kinds of research-driven, business-oriented infographics is what we call the ‘what-why-how’ approach:
| What | State the problem/scenario/concept, support with key facts |
| Why | Tell the reader why it’s important and set out the benefits they could receive if following the recommendations |
| How | Propose solutions as to how the issue or concept can be managed, improved or eradicated |
This structure follows the AIDA model for content marketing – Awareness, Interest, Desire, Action – where the best way to create good i.e. shareable, content is to give something of value to your audience. In other words, you are educating the reader and also providing solutions for their problem.
The more ‘how’ you can provide then the more value you’re giving to the reader (for free!) and potentially the more shares and higher levels of engagement.
2. Make it accurate
In order to create a good infographic design, the data needs to be true and accurate. We check, double-check, and then check our work again to make sure the data and the conclusions drawn from it are correct.
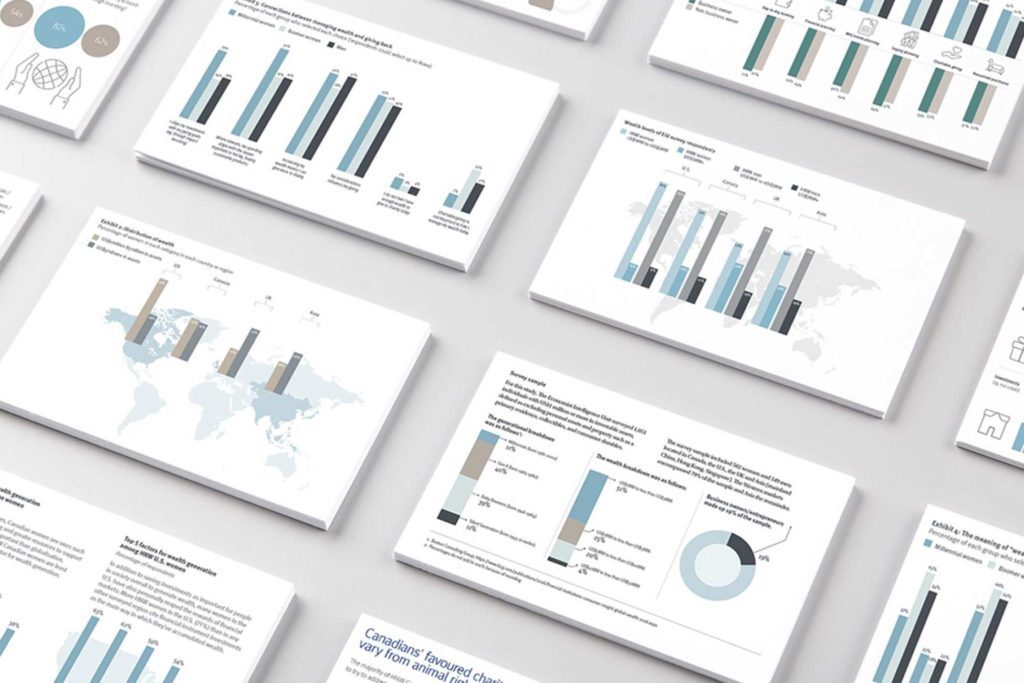
But it’s not just the figures themselves that need to be accurate. Depending on the data, the way it is shown needs to be appropriate too. Something as simple as using the wrong kind of chart to show key data points could affect your readers’ perception of your expertise.
Which links into our final point…
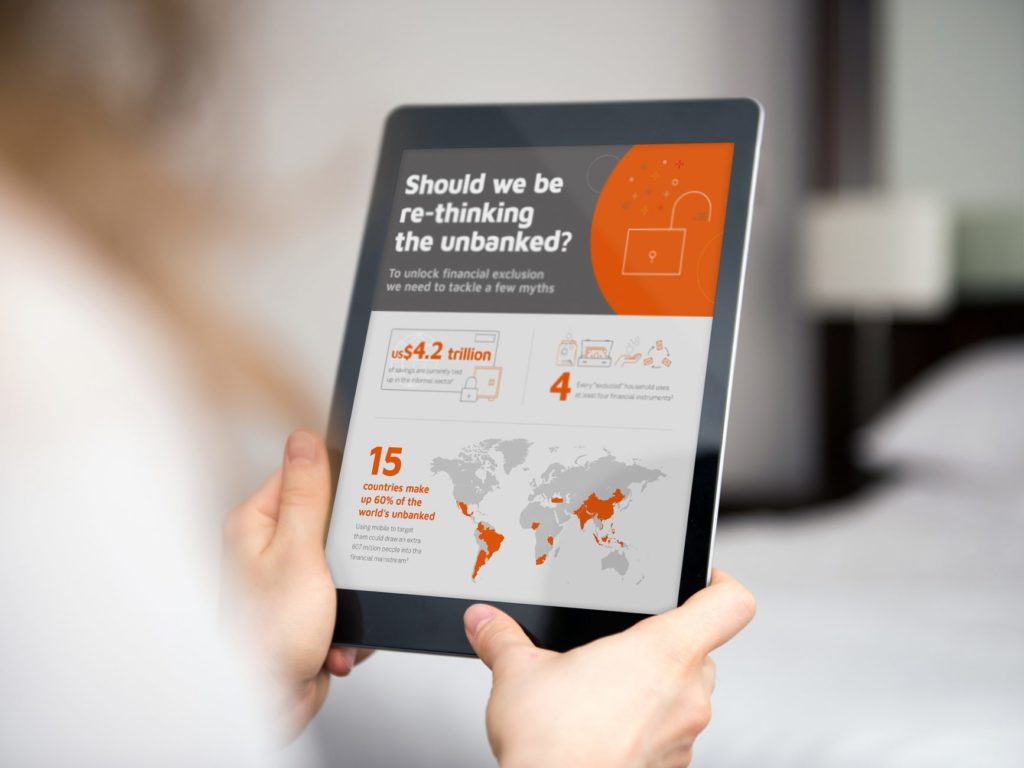
3. Make it visually engaging
Visually engaging doesn’t necessarily mean a fancy design. Rather, it means the correct design choices in relation to:
- the target audience
- the subject matter
- the presentation of data
Imagine how different a scientific research infographic would look compared to a technology or sports-based piece – the audiences, content, types of data, and overall purpose of each would be very different so its design should be too.
A good place to start is to research the kinds of information and visual styles the audience are already sharing and engaging with.
——
Hopefully this has given you some ideas for starting your infographic. To make it even easier, we’ve put together a handy template incorporating all of these ideas that you can use for your brainstorming.